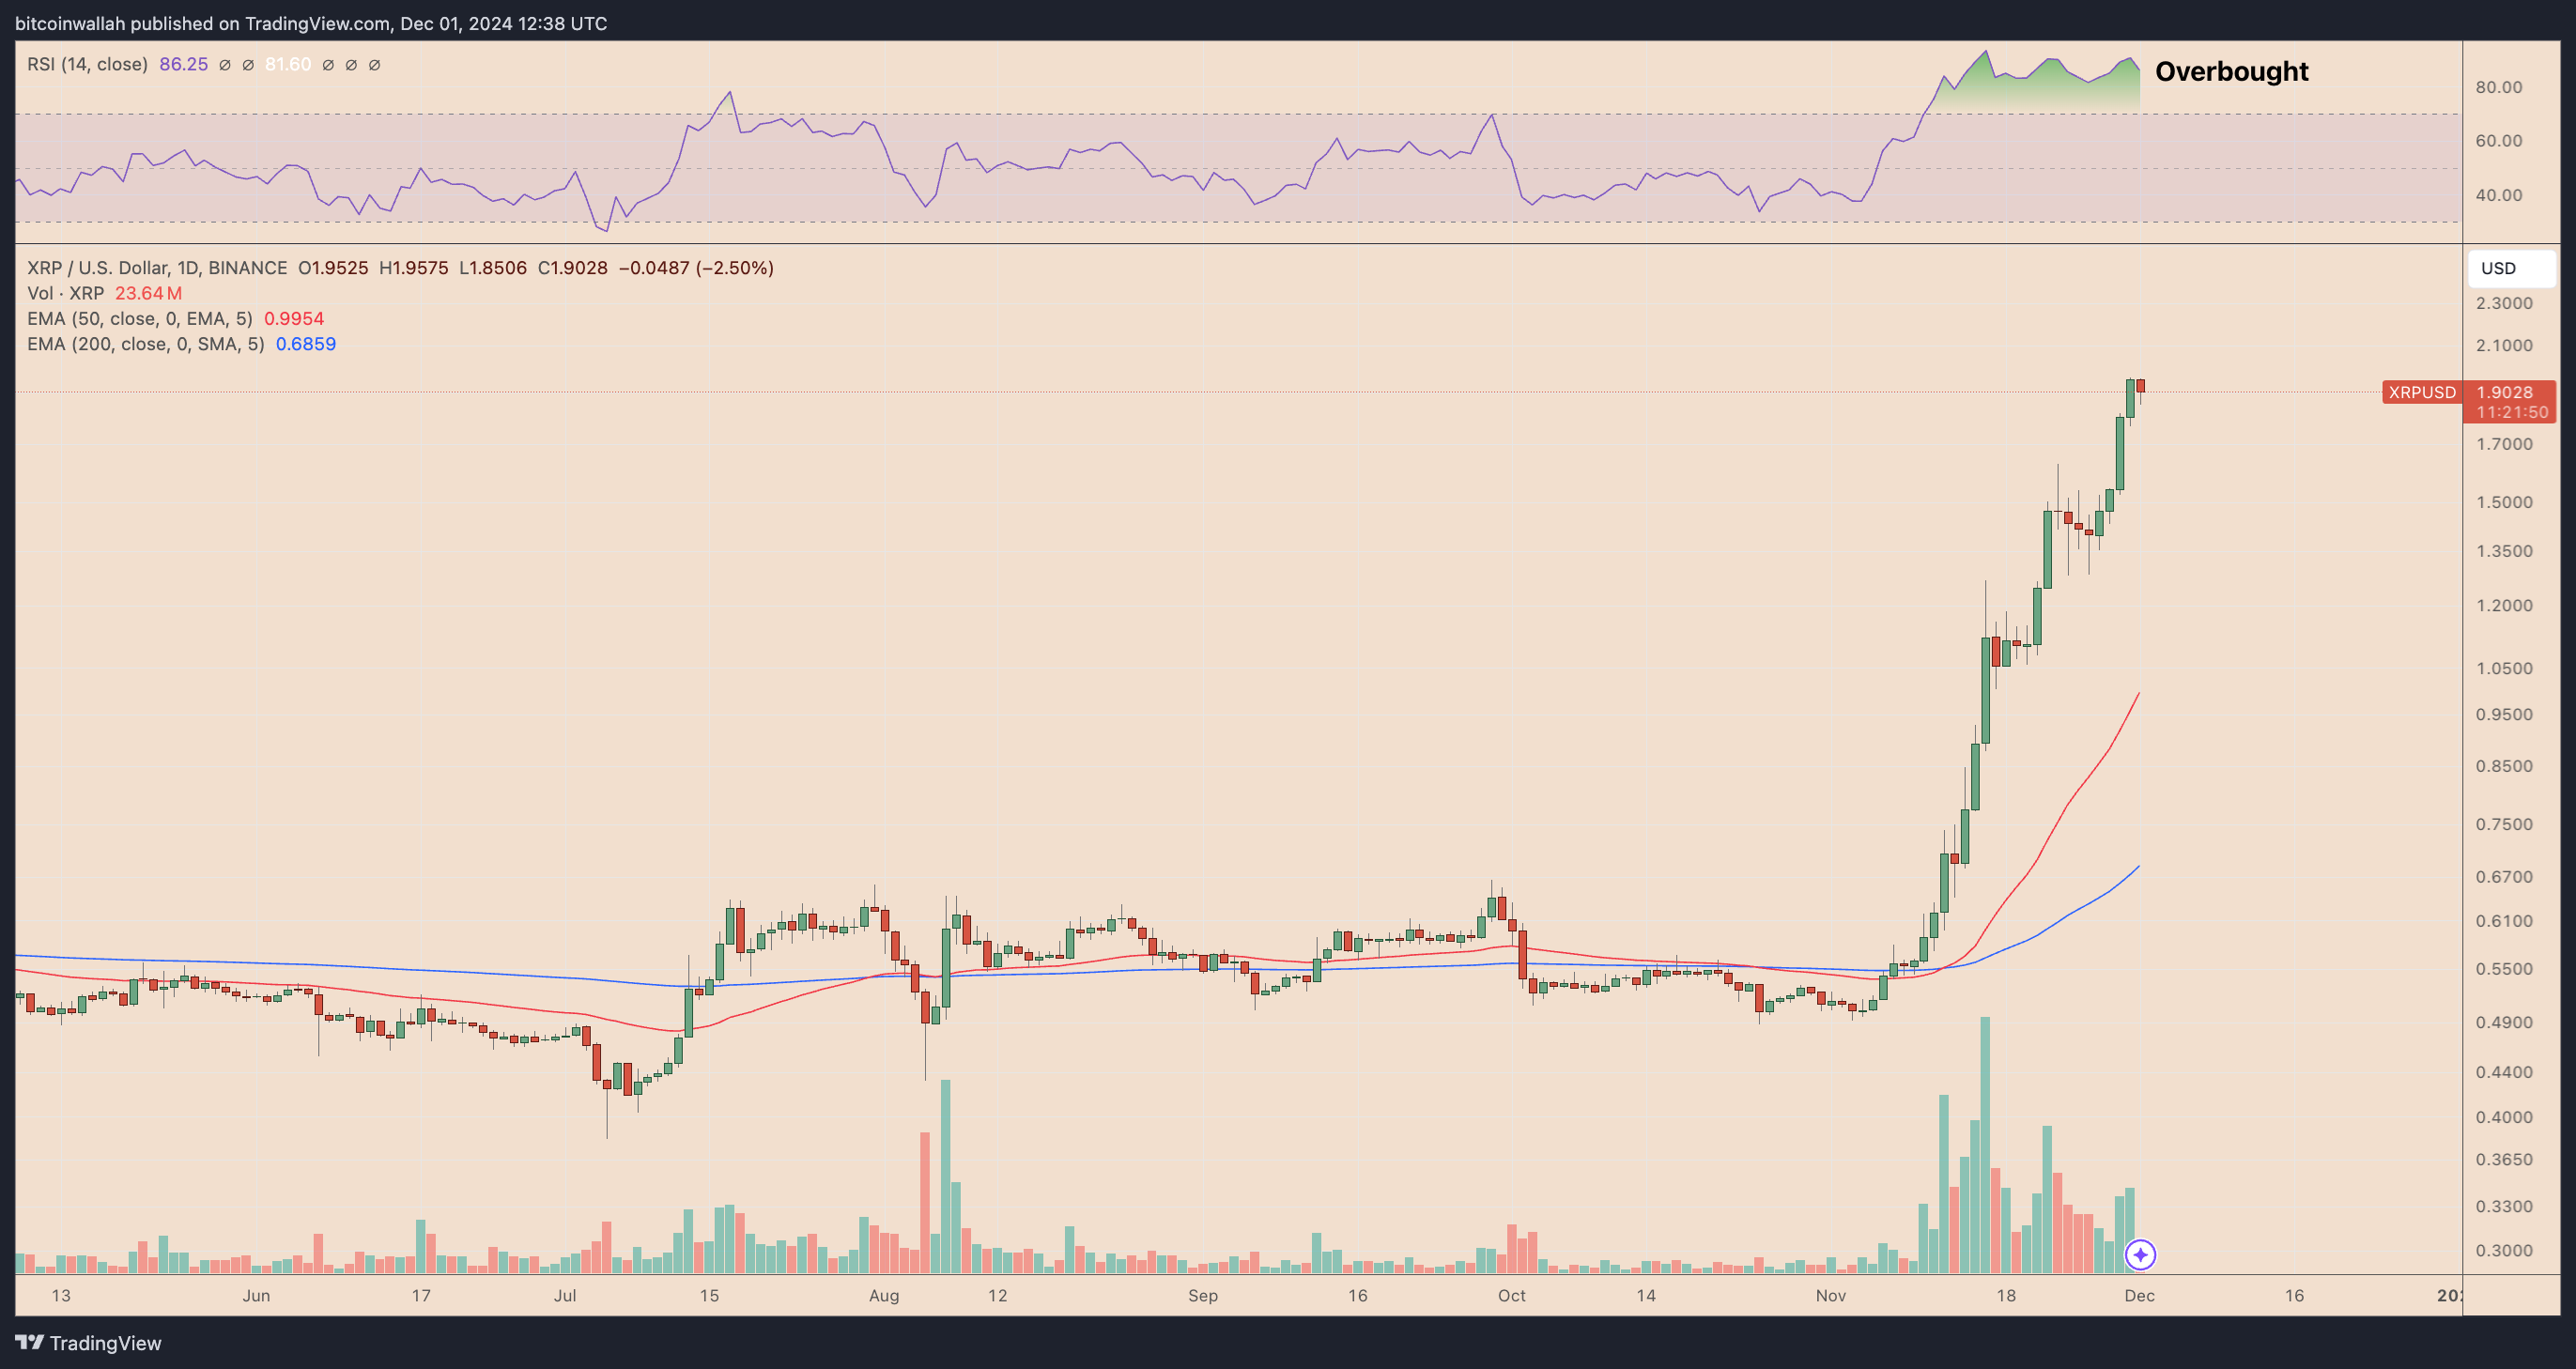
On Dec. 1, XRP (XRP) dropped by around 5.50% to as low as $1.85, showing signs of bullish exhaustion after rallying 45% in the past four days.
XRP “overbought” — Bigger drop ahead?
XRP’s decline today appears as its daily relative strength index (RSI) continues to alert the market about its overbought conditions.
When the RSI reading exceeds 70, technical analysts often interpret it as a signal that the asset is overbought. This means the price may have risen too quickly, and the asset could be overvalued in the short term.
XRP/USD daily price chart. Source: TradingView
Such conditions might precede a price pullback or consolidation phase, such as the one in the XRP market today, with its daily RSI hovering around 90.75.
The warning also extends to XRP’s weekly chart, with another “overbought” RSI reading of 88.42.
XRP/USD weekly price chart. Source: TradingView
The same chart shows XRP trading near its April 2021 top, a historically significant area of resistance.
If XRP/USD fails to clear this hurdle, the downside target for December could be around $1.625, coinciding with the 0.786 Fibonacci retracement line. That is down 15% from the current price levels.
XRP whales are cutting their holdings
XRP’s price losses today further coincide with the decrease in supply held by its richest traders, or “whales.”
Notably, whale addresses holding at least 100,000 XRP have reduced their token holdings by 30 million since Nov. 24, indicating that some big investors have been selling XRP at its local price tops.
XRP supply in addresses with over 100,000 tokens. Source: Messari
Selling pressure at local price peaks creates downward momentum, making it harder for the price to sustain its gains. Several whales’ decision to offload XRP near key resistance levels—such as the April 2021 peak—could see this level hold as resistance in the coming months.
XRP hits key resistance zone
XRP’s price correction has started after reaching the upper trendline of its prevailing ascending channel pattern.
XRP/USD weekly price chart. Source: TradingView
In previous instances, these tests triggered sell-offs ranging between 16% and 21%.
Related: Bitcoin dominance hints at ‘altseason,’ analysts eye XRP price rally into 2025
Currently, XRP’s price is again retreating after touching the upper trendline, with early signs suggesting another potential correction.
If historical patterns hold, XRP price could decline by a similar margin, potentially finding support near the channel’s lower boundary or converging with the 50-period EMA (red wave) at $1.58.
This article does not contain investment advice or recommendations. Every investment and trading move involves risk, and readers should conduct their own research when making a decision.


