The cryptocurrency market is in the red today, following the slump in US stocks as all eyes turn to Nvidia’s upcoming earnings report. This highly anticipated release is seen as a potential turning point, offering clues on whether the AI-fueled bull market still has legs or if the rally is starting to lose steam.
Nvidia’s slower growth prospects hurt Nasdaq, crypto
Analysts surveyed by FactSet expect Nvidia to post second-quarter adjusted earnings of approximately 65 cents per share, with revenue projected at $28.74 billion. This figure represents more than double the revenue from the same quarter in 2023.
However, it also signals a deceleration in growth, as Nvidia’s revenue more than tripled year-over-year in the April quarter. Nvidia’s stock was wobbling between gains and losses ahead of the earnings report, taking the Nasdaq 100 on a similar seesaw trend.

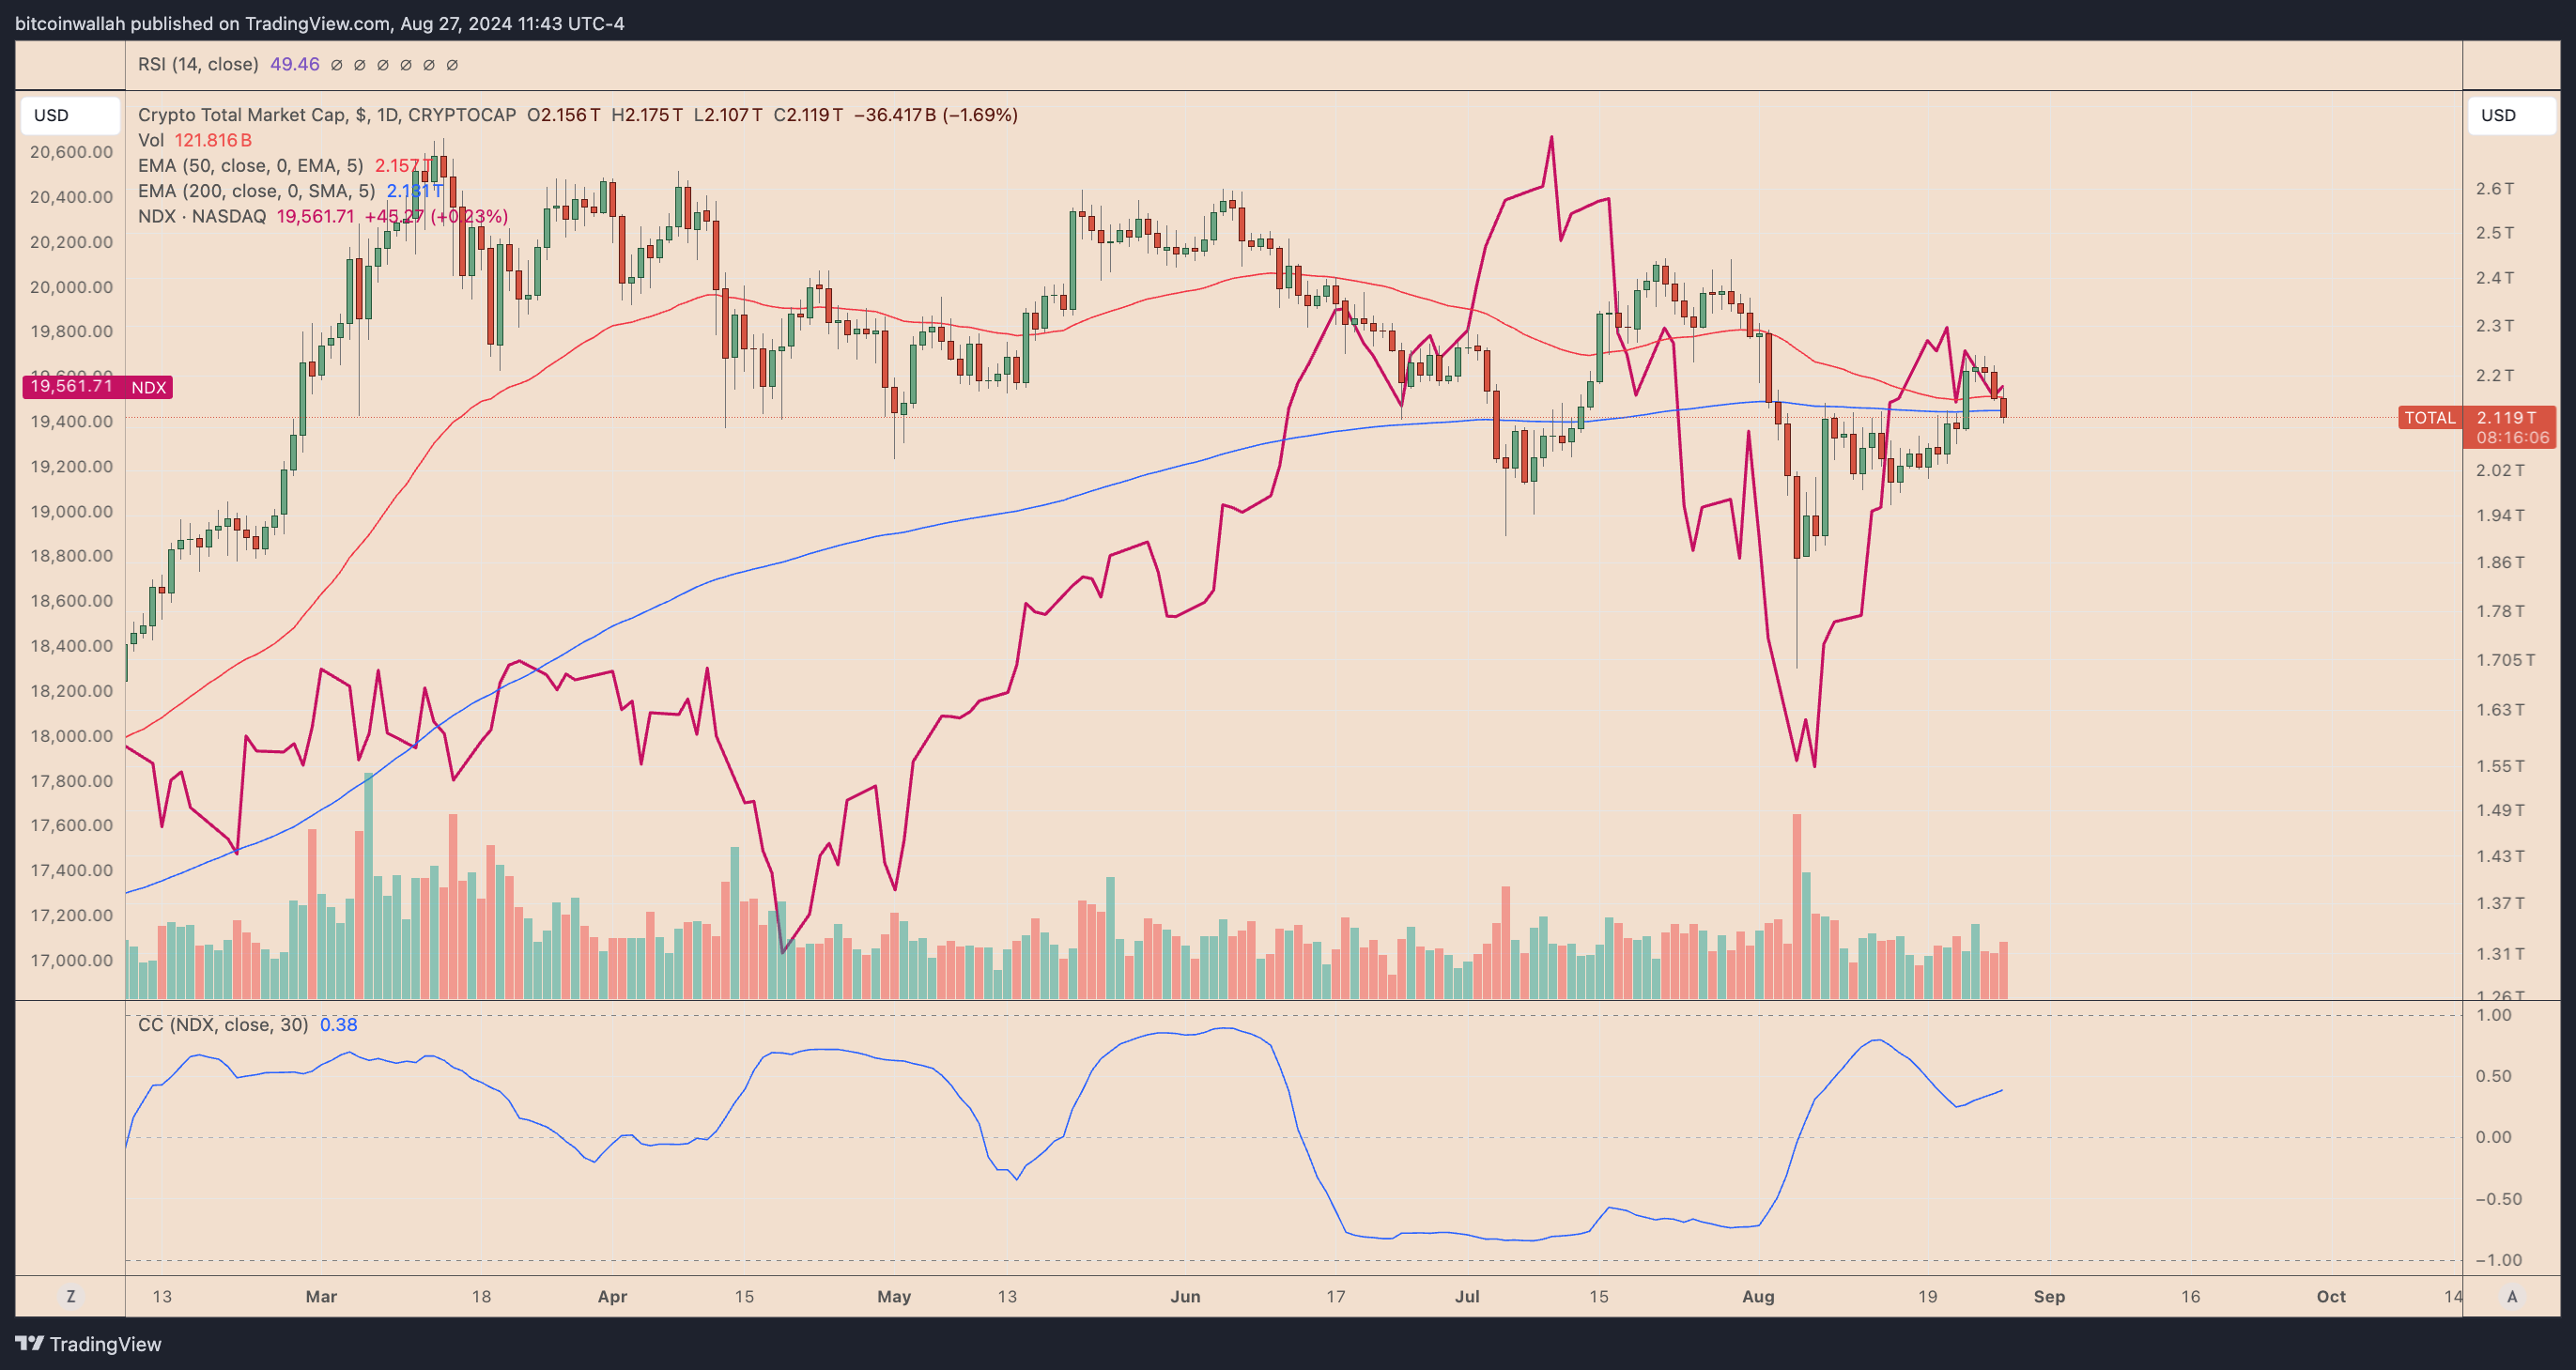
The cryptocurrency market, which had a 30-day average correlation coefficient of 0.40 with the Nasdaq 100 as of Aug. 27, and has maintained a positive correlation with the index throughout the month, also declined in tandem.
Related: AI tokens market cap rebound 79.7% to $32B amid renewed investor confidence
Long liquidations are outrunning shorts
The crypto market decline has gained momentum due to $143.70 million worth of liquidations in the last 24 hours, of which $126.34 million are longs. Meanwhile, the crypto futures market’s open interest (OI) has dropped by approximately 1.80% in the same period.

The significant liquidation of long positions suggests that many traders were too bullish and over-leveraged.
When the market moves against these positions, it triggers a cascade of liquidations, exacerbating the downward price movement. This scenario often leads to a rapid decline as stop-losses and margin calls are hit.
Meanwhile, the OI reduction signals a decrease in active futures contracts, indicating that traders are closing their positions and stepping back from the market.
Nonetheless, funding rates of most top coins, including Bitcoin (BTC) and Ether (ETH), are positive, indicating that traders still in the market are generally more bullish, as they are willing to pay a premium to maintain long positions.

Crypto chart: technical pullback
Today’s decline in the crypto market is part of a broader pullback. The move began after the market tested its ongoing descending channel pattern’s upper trendline and encountered resistance, similar to what happened in June and July.

As of Aug. 27, the market cap was breaking below its 200-day exponential moving average (200-day EMA; the blue wave) at around $2.13 trillion, eyeing a decline toward the channel’s lower trendline around the $1.80-1.72 trillion area.
This article does not contain investment advice or recommendations. Every investment and trading move involves risk, and readers should conduct their own research when making a decision.


