SOL, the native cryptocurrency of the Solana network, has dropped over 15% in the last seven days to reach a low of $138.22 on Aug. 16. SOL’s 30-day losses stand around 14% and 18% in the 90-day timeframe.

SOL’s performance over the last day has been accompanied by a leap in its trading volume, which has increased by 50% to $3.26 billion, asserting the intensity of the sell-side activity. The decrease in price and high trading activity has seen its total market capitalization drop to $64.52 billion, but according to data from CoinMarketCap, SOL still maintains its position as the fifth-largest cryptocurrency.
Let’s look at the top catalysts driving SOL’s price lower.
Solana memecoins are bleeding
Solana is trading in a third consecutive bearish session on Aug. 16, coinciding with an ongoing sell-off in the prices of memecoins on its network. Most are posting double-digit losses, as shown in the figure below.

For instance, Dogwifhat (WIF), the leading Solana memecoin by market capitalization, has dropped by over 13.5% on a 24-hour adjusted timeframe. Similarly, Bonk (BONK), Book of Meme (BOME) and Popcat (POPCAT), have dropped 12%, 13% and 23%, respectively, in the same period.
This drop in the prices of memecoins accompanies a decline in onchain activity within the Solana ecosystem, according to the data provided by Dune dashboard pump.fun. Today’s SOL price drop was preceded by a sharp drop in the number of transactions deployed on the network.
The chart below shows that daily transactions on the Solana blockchain decreased from 20,465 to 4,332 between Aug. 13 and Aug. 16.

The drop in the number of transactions on Solana indicates suppressed network activity and a drop in user interaction with the platform leads to decreased network usage and lower revenues.
Additional data from Dune reveals a sharp reduction in Solana’s daily revenue, which currently stands at 4,159 SOL (~$575,000) on Aug. 16, down from a year-to-date high of 35,076 SOL (~4.85 million) on Aug. 12.

Solana TVL has decreased over the last month
Data from DefiLlama shows Solana’s total value locked (TVL) has been on a downward trend over the last week. The chart below shows that Solana’s TVL has fallen by 5.2% over the last seven days, from $5.02 billion on Aug. 9 to $4.76 billion at the time of publication.

This drop in TVL has occurred in tandem with the decrease in SOL’s price, which is more than 15% over the same period.
Taking a closer look at Solana’s TVL decrease, several layer 2 protocols, such as Jito and Sanctum, have posted substantial losses in total value locked over the last month, contributing to the drop in the value of the underlying network.

The declining TVL reflects traders’ fading interest and could be a sign that Solana struggles to attract new users despite its lower traction costs.
Related: Price analysis 8/14: BTC, ETH, BNB, SOL, XRP, DOGE, TON, ADA, AVAX, SHIB
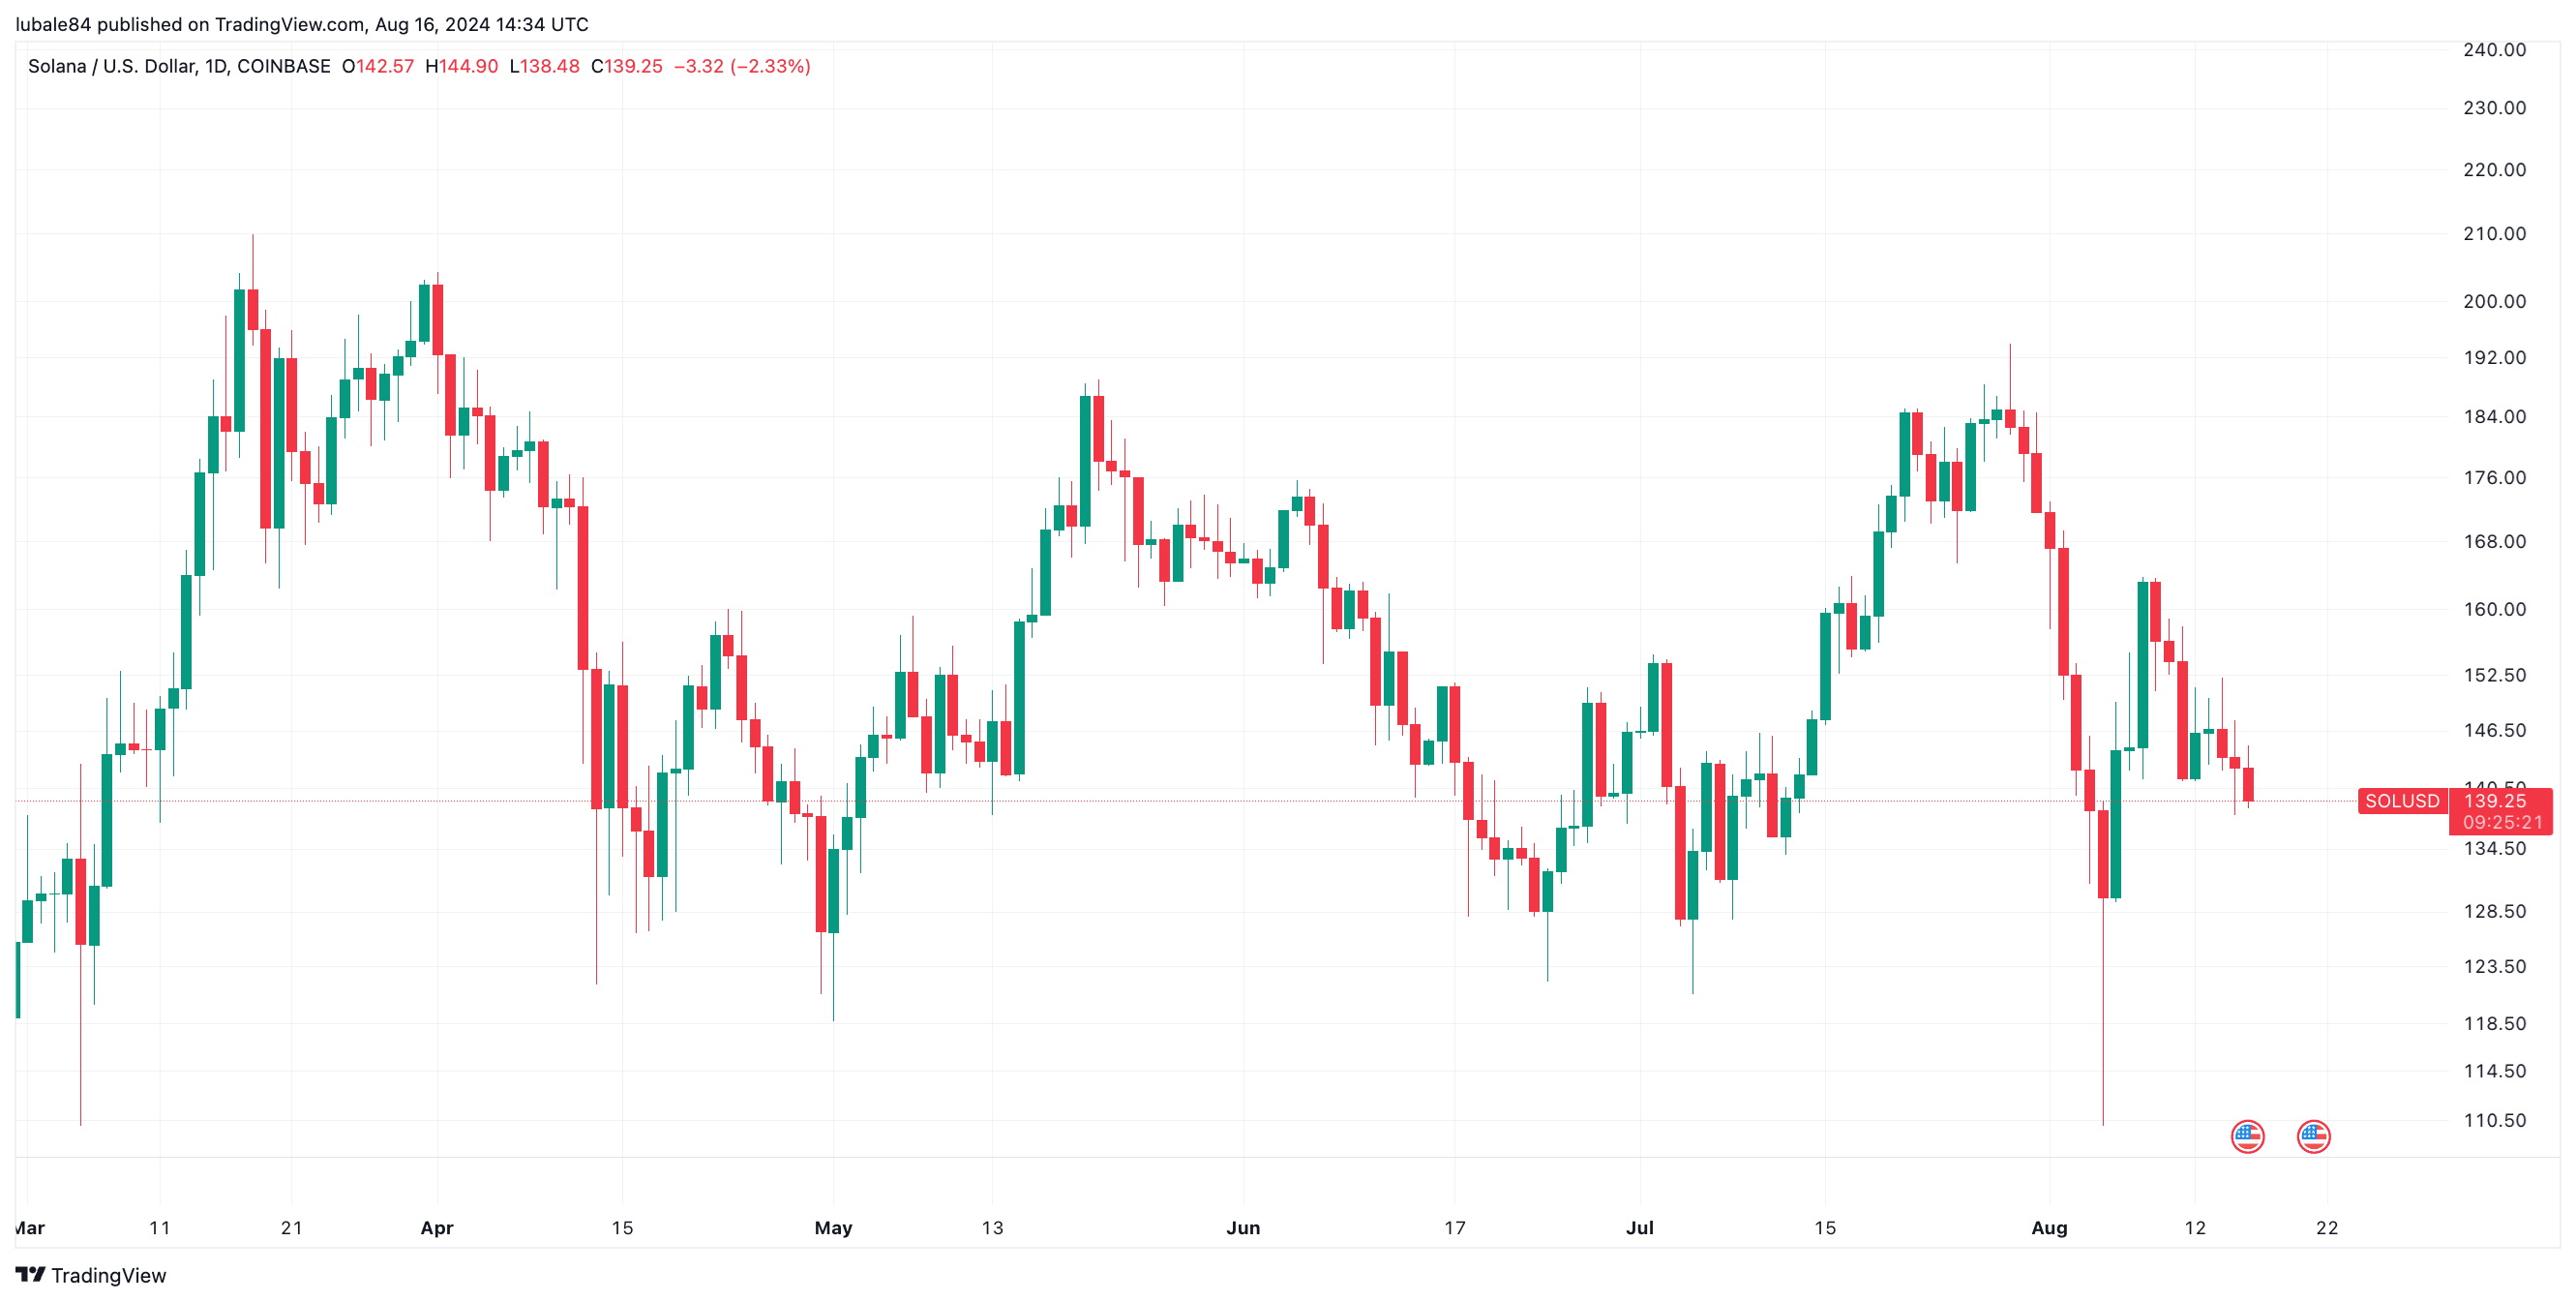
SOL’s market structure hints at a retest of $122
SOL’s price action in the daily timeframe has painted an inverted V-shaped pattern, as shown in the chart below. The supplier congestion zone between $150 and $155 is acting as an area of stiff resistance on the upside. Note that this is where the 50-day, 100-day and 200-day exponential moving averages (EMAs) currently sit.
The relative strength index (RSI) is dropping toward the 30 mark, asserting the sellers’ dominance in the market. The bears now focus on the immediate support at $135 and, later, the neckline of the prevailing chart pattern at $130.
A daily candlestick close below this level would confirm the continuation of the downtrend. The next logical move would be to the July 5 range low at $122.

On the upside, holding above $135 would signal the inability of the sellers to extend the uptrend. If this happens, SOL could rise above the $150 to $155 supply zone and later to the pattern’s high at $165, invalidating the bearish outlook.
This article is for general information purposes and is not intended to be and should not be taken as legal or investment advice. The views, thoughts, and opinions expressed here are the author’s alone and do not necessarily reflect or represent the views and opinions of Cointelegraph.