Bitcoin (BTC) bulls are trying to defend the $94,000 level, but the bears have maintained their selling pressure. Bitcoin’s dull price action, clubbed with the ongoing trade tensions between the US and China and muted interest rate expectations from the US Federal Reserve, could have hurt investors’ sentiment. That resulted in $1.14 billion in outflows from the US-based spot Bitcoin exchange-traded funds in the past two weeks, according to SoSoValue data.
However, Michael Saylor’s Strategy, formerly known as MicroStrategy, maintains its bullish view and has continued to build its Bitcoin portfolio. The firm bought 20,356 Bitcoin for $1.99 billion at an average price of $97,514, increasing its total holdings to 499,096 Bitcoin.

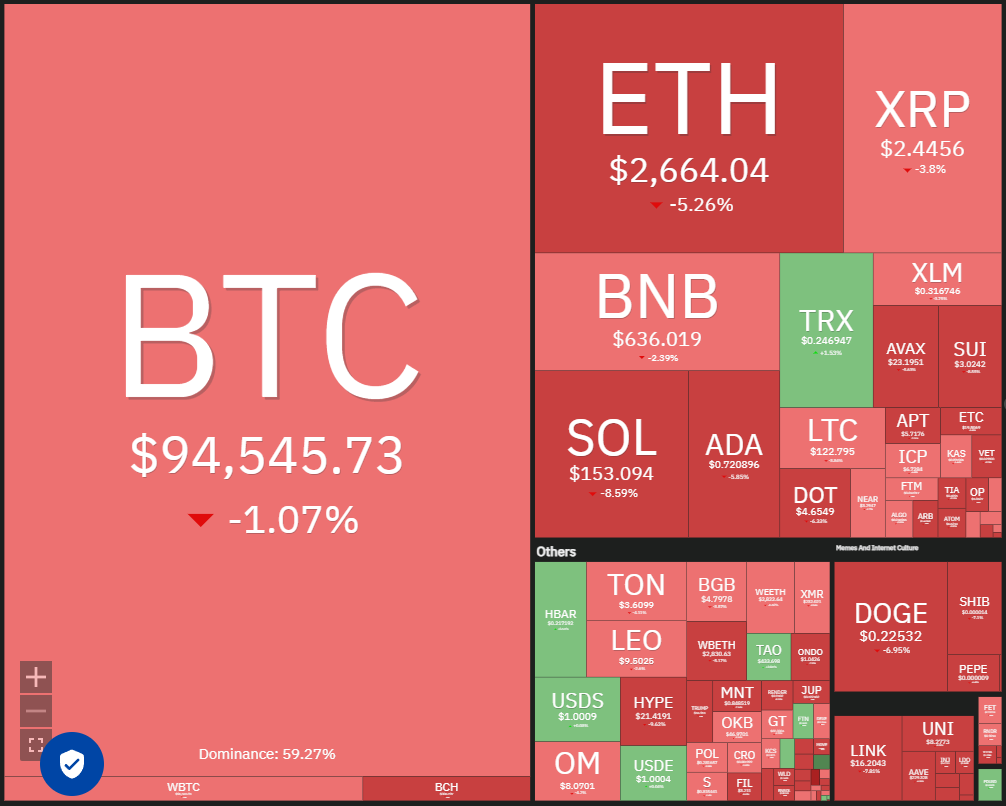
Daily cryptocurrency market performance. Source: Coin360
Bitcoin’s range-bound price action has pulled its 1-week realized volatility to 23.42%, according to onchain analytics firm Glassnode. The firm added that previous occurrences of similar volatility compressions have been followed by “major market moves.”
Could Bitcoin break to the downside? What are the crucial support levels to watch out for? Let’s analyze the charts to find out.
S&P 500 Index price analysis
The S&P 500 Index (SPX) closed above the 6,128 resistance on Feb. 18 and made a new all-time high of 6,147 on Feb. 19, but the bulls could not sustain the higher levels.

SPX daily chart. Source: Cointelegraph/TradingView
The price slipped back below 6,128 on Feb. 20 and nosedived below the 20-day exponential moving average (6,057) on Feb. 21. Buyers will have to defend the 50-day simple moving average (6,008) to keep the upper hand. If the price rebounds off the 50-day SMA with force, the possibility of a break above 6,147 increases. The index may then climb to 6,403.
Contrarily, a close below the 50-day SMA suggests that the index may remain range-bound between 6,128 and 5,853 for a few days.
US Dollar Index price analysis
The US Dollar Index (DXY) has been gradually dropping toward solid support at 105.42, which is likely to attract buyers.

DXY daily chart. Source: Cointelegraph/TradingView
The downsloping 20-day EMA (107.36) and the RSI in the negative zone indicate an advantage to sellers. Any attempt to start a recovery is likely to face strong selling at the 20-day EMA. If the price turns down sharply from the 20-day EMA, the risk of a break below 105.42 increases.
The first sign of strength will be a break and close above the 20-day EMA. The index may then climb to 108, which is likely to act as a strong hurdle.
Bitcoin price analysis
Bitcoin remains stuck inside a tight range between $100,000 and $93,388, indicating indecision between the bulls and the bears.

BTC/USDT daily chart. Source: Cointelegraph/TradingView
The gradually downsloping 20-day EMA ($97,067) and the RSI just below the midpoint do not give a clear advantage either to the bulls or the bears. If the price breaks below $93,388, the BTC/USDT pair could drop to the critical support at $90,000. This remains the key short-term resistance to watch out for because a break below it will complete a bearish double-top pattern.
Conversely, if the price turns up and breaks above $100,000, it will signal that the bulls are back in the game. The pair could rise to $102,500 and later to $106,500. Buyers may face significant resistance at $109,588.
Ether price analysis
Ether (ETH) failed to rise above the breakdown level of $2,850 on Feb. 23, indicating that demand dries up at higher levels.

ETH/USDT daily chart. Source: Cointelegraph/TradingView
If the price sustains below the 20-day EMA ($2,765), the ETH/USDT pair could fall to $2,600 and then to $2,500. Buyers will try to arrest the decline at $2,500, but if they fail, the pair could tumble to $2,300.
The bulls will have to propel the price above the downtrend line to signal a potential comeback. The pair could then attempt a rally to $3,450 and subsequently to $3,750. Such a move will bring the large $2,111 to $4,094 range into play.
XRP price analysis
XRP (XRP) broke below the 20-day EMA ($2.61) on Feb. 21 and continued its drop toward the support line of the symmetrical triangle pattern.

XRP/USDT daily chart. Source: Cointelegraph/TradingView
Buyers are expected to defend the support line, but the relief rally is likely to face selling at the 20-day EMA. If the price turns down sharply from the 20-day EMA, it will suggest that the bears continue to sell on rallies. The XRP/USDT pair then risks a fall below the support line. If that happens, the pair could collapse to $1.77.
The bulls will have to push and maintain the price above the moving averages to signal that the pair may remain inside the triangle for a while longer.
BNB price analysis
BNB (BNB) has been trading between the 50-day SMA ($664) and the $635 support for the past few days.

BNB/USDT daily chart. Source: Cointelegraph/TradingView
The flattish 20-day EMA ($651) and the RSI just below the midpoint signal a balance between supply and demand. If the price skids below $635, the advantage will tilt in favor of the bears. The BNB/USDT pair could then drop to $596.
Contrarily, a strong bounce off $635 will signal that the bulls are aggressively defending the level. A break and close above the 50-day SMA suggest that the pair may extend its stay inside the $635 to $745 range for a few more days.
Solana price analysis
Solana (SOL) turned down from the breakdown level of $175 on Feb. 21, indicating that the bears have flipped the level into resistance.

SOL/USDT daily chart. Source: Cointelegraph/TradingView
The downsloping 20-day EMA ($184) and the RSI near the oversold level indicate that the bears are in control. If the price remains below $155, the selling could pick up, and the SOL/USDT pair may plummet to $133.
If buyers want to prevent the decline, they will have to quickly push the price back above the 20-day EMA. That suggests the markets have rejected the break below $175. The pair may then rise to the 50-day SMA ($206).
Related: Why is the crypto market down today?
Dogecoin price analysis
Dogecoin (DOGE) has continued its downward journey, reaching the support line of the descending channel pattern.

DOGE/USDT daily chart. Source: Cointelegraph/TradingView
The bulls will try to start a recovery from the support line but may face solid selling at the 20-day EMA ($0.26). If the price turns down from the 20-day EMA, the possibility of a break below the support line increases. If that happens, the DOGE/USDT pair could descend to the next significant support at $0.15.
Contrary to this assumption, if the price turns up from the support line and breaks above the 20-day EMA, it will signal that the selling pressure is reducing. The pair may attempt a rally to the 50-day SMA ($0.30).
Cardano price analysis
Cardano (ADA) turned down from the 20-day EMA ($0.78) on Feb. 23, indicating that the bears are fiercely defending the level.

ADA/USDT daily chart. Source: Cointelegraph/TradingView
If the price remains below $0.73, the ADA/USDT pair could continue its downward move toward the channel’s support line. The bulls will try to defend the support line, but if the bears prevail, the pair could plunge to $0.50.
This bearish view will be invalidated in the near term if the price turns up and breaks above the 20-day EMA. That could open the door for a rise to the 50-day SMA ($0.88) and, after that, to the resistance line.
Chainlink price analysis
Chainlink (LINK) resumed its downtrend after bears pulled the price below the $17.28 support on Feb. 21.

LINK/USDT daily chart. Source: Cointelegraph/TradingView
The LINK/USDT pair could drop to the support line of the descending channel pattern, which is an important near-term support to watch out for. If this level cracks, the selling could pick up, and the pair may tumble to $13.
The first sign of strength will be a break and close above the 20-day EMA ($18.72). That suggests the selling pressure is reducing. The pair may then attempt a rally to the 50-day SMA ($21.08).
This article does not contain investment advice or recommendations. Every investment and trading move involves risk, and readers should conduct their own research when making a decision.