Bitcoin (BTC) is due to “regain the spotlight” as BTC price gains catch up with United States equities, new analysis says.
In his latest blog post on Oct. 19, Caleb Franzen, creator of financial research resource Cubic Analytics, saw the potential for a major BTC price breakout.
“Highly effective” BTC price tool demands gains
Bitcoin needs to recover to match the recent performance of US stocks, as the S&P 500 notches repeat all-time highs.
For Franzen, who compared BTC/USD to the Invesco S&P 500 Equal Weight ETF (RSP), the writing could well be on the wall.
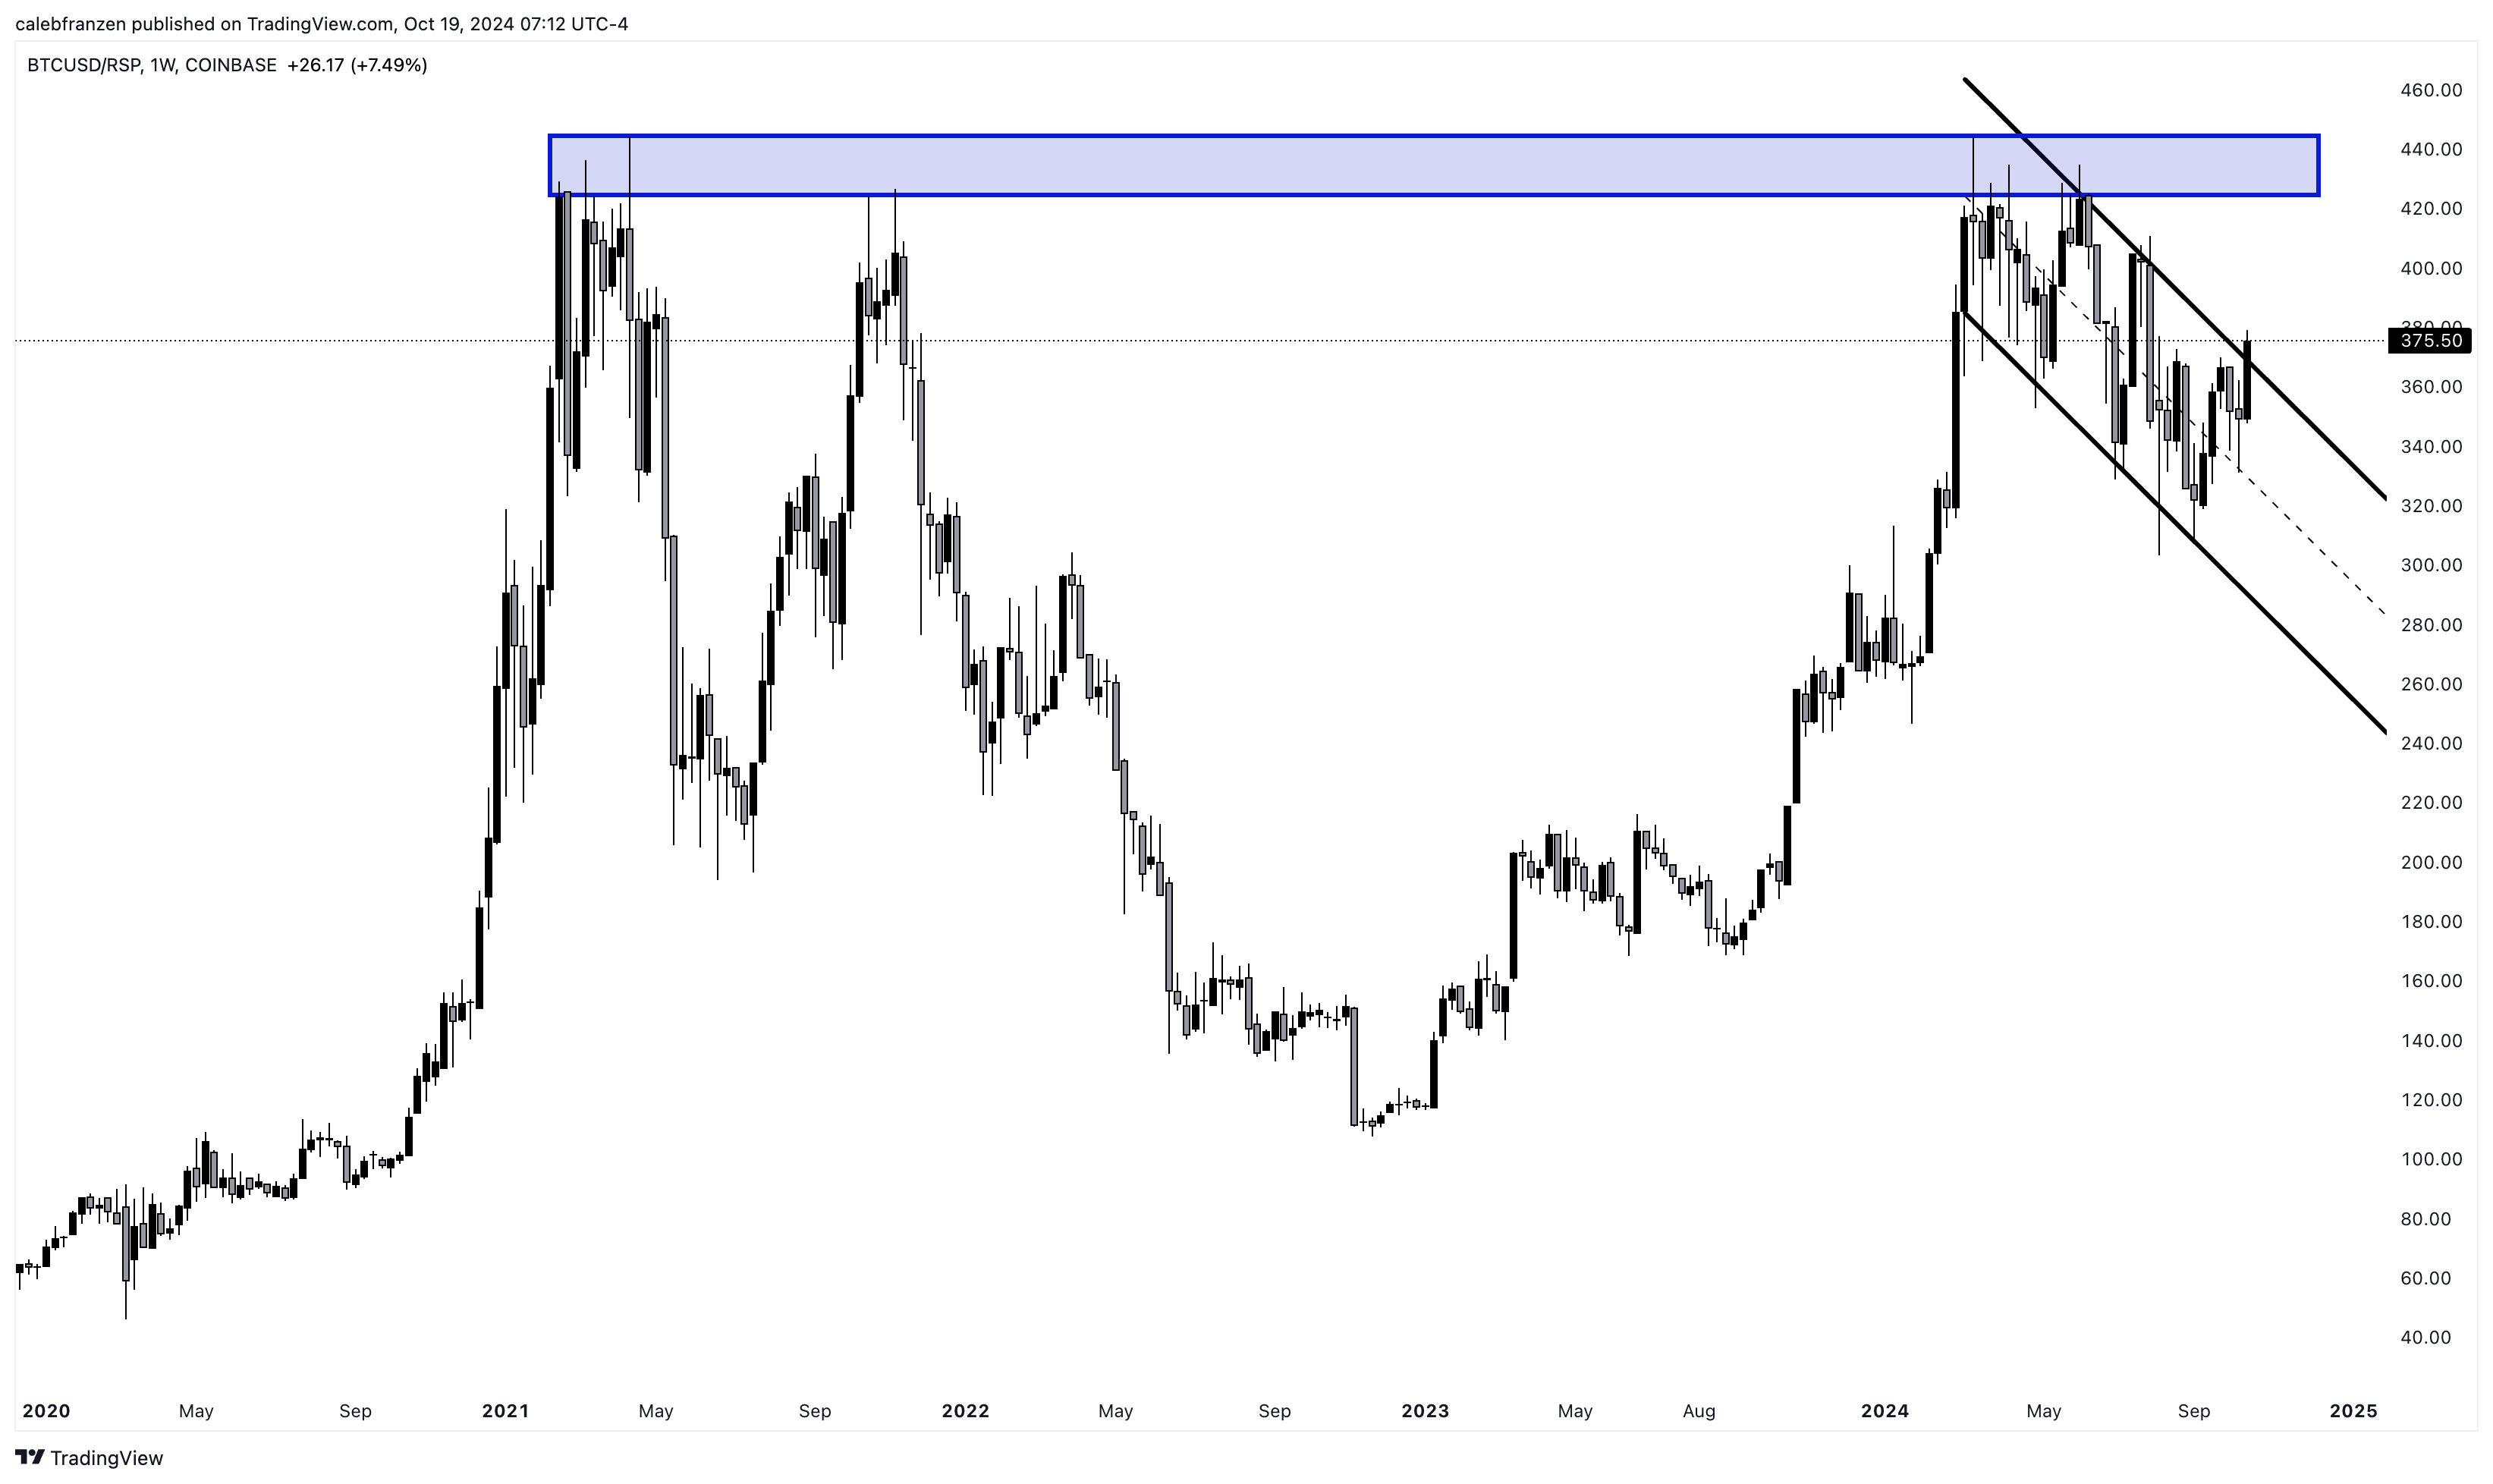
“On a relative basis, Bitcoin failed to produce new ATH’s vs. the equal-weight S&P 500. In fact, BTC/RSP was rejected precisely on the former ATHs from 2021 and has been consolidating since then, which I’ve illustrated with a regression channel,” he wrote alongside a corresponding chart.
“However… That BTC/RSP is starting to break above of that regression channel.”

BTC/USD vs. RSP 1-week chart. Source: Cubic Analytics
Franzen thus saw an option for traders to go short RSP and long BTC next.
“Based on this structure, the ongoing breakout implies a return back to the blue zone,” he continued.
“To be clear, that blue zone is still valid potential resistance, but it’s also a price target.”
Franzen bolstered his optimism on the outlook for BTC/USD using the Williams%R Oscillator, a trend strength tool covering multiple timeframes.
On this occasion, its 120-day iteration suggests further upside to come, having rebounded from macro lows in its “oversold” zone in July.
“As we can see, this signal is both rare & highly effective,” he concluded.
Identical bottom signals occurred in January 2024 and October 2023. On those occasions, BTC/USD gained 48% and 123%, respectively, over the subsequent three-month period.
“With Bitcoin currently trading at its highest prices since July 2024, investors are regaining confidence in the potential for continued upside, particularly with stocks at all-time highs,” the post added.

BTC/USD 1-day chart with Williams%R Oscillator data. Source: Cubic Analytics
Bitcoin breakout excitement gathers pace
As Cointelegraph reported, BTC price predictions favor a new macro high in 2025, but short-term punts also see upside continuation.
Related: 3 signs Bitcoin’s ‘parabolic phase’ with a $250K target is about to begin
Now simmering below $69,000, final resistance stands between spot price and a return to price discovery—resistance that has nonetheless held since March.
The first daily closes above a descending channel in place since then is fueling the bullish narrative.
Commenting this weekend, popular trader and analyst Rekt Capital emphasized the significance of current BTC price moves.
“History has been made as Bitcoin has registered its first Daily Candle Close above the red resistance area,” he told X followers alongside an explanatory chart.
“Bitcoin will now try to retest the top of this resistance into new support. Generally, Bitcoin just needs to stay above $66400 (black Channel Top) to enjoy a bullish Weekly Close.”

BTC/USD 1-day chart. Source: Rekt Capital/X
This article does not contain investment advice or recommendations. Every investment and trading move involves risk, and readers should conduct their own research when making a decision.